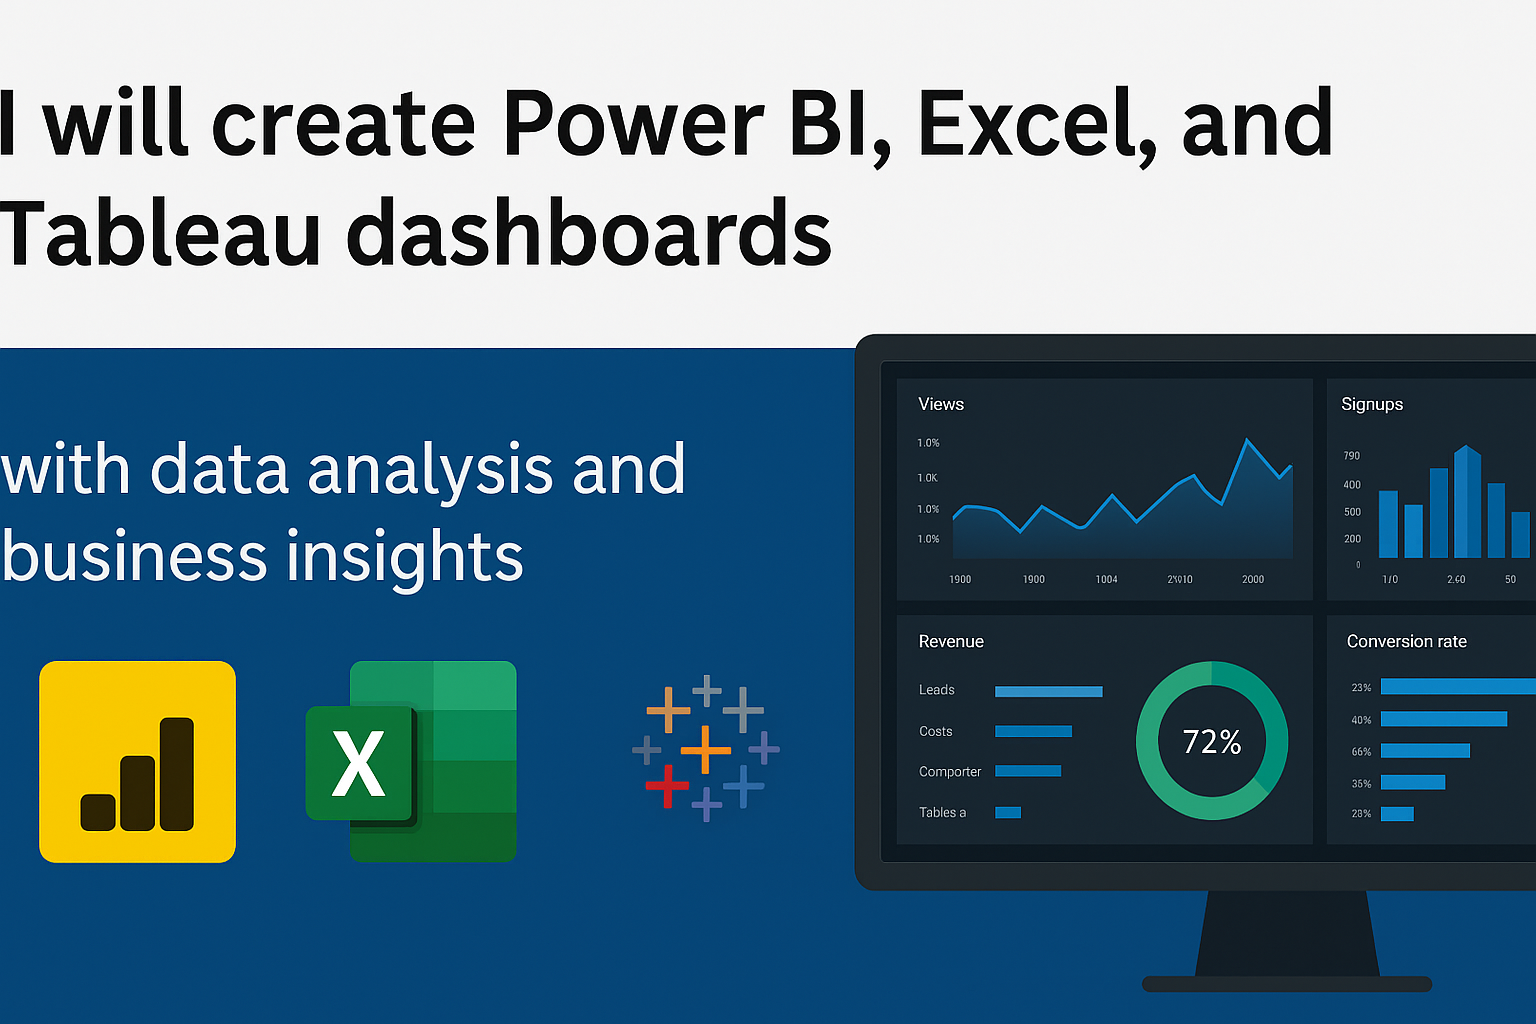
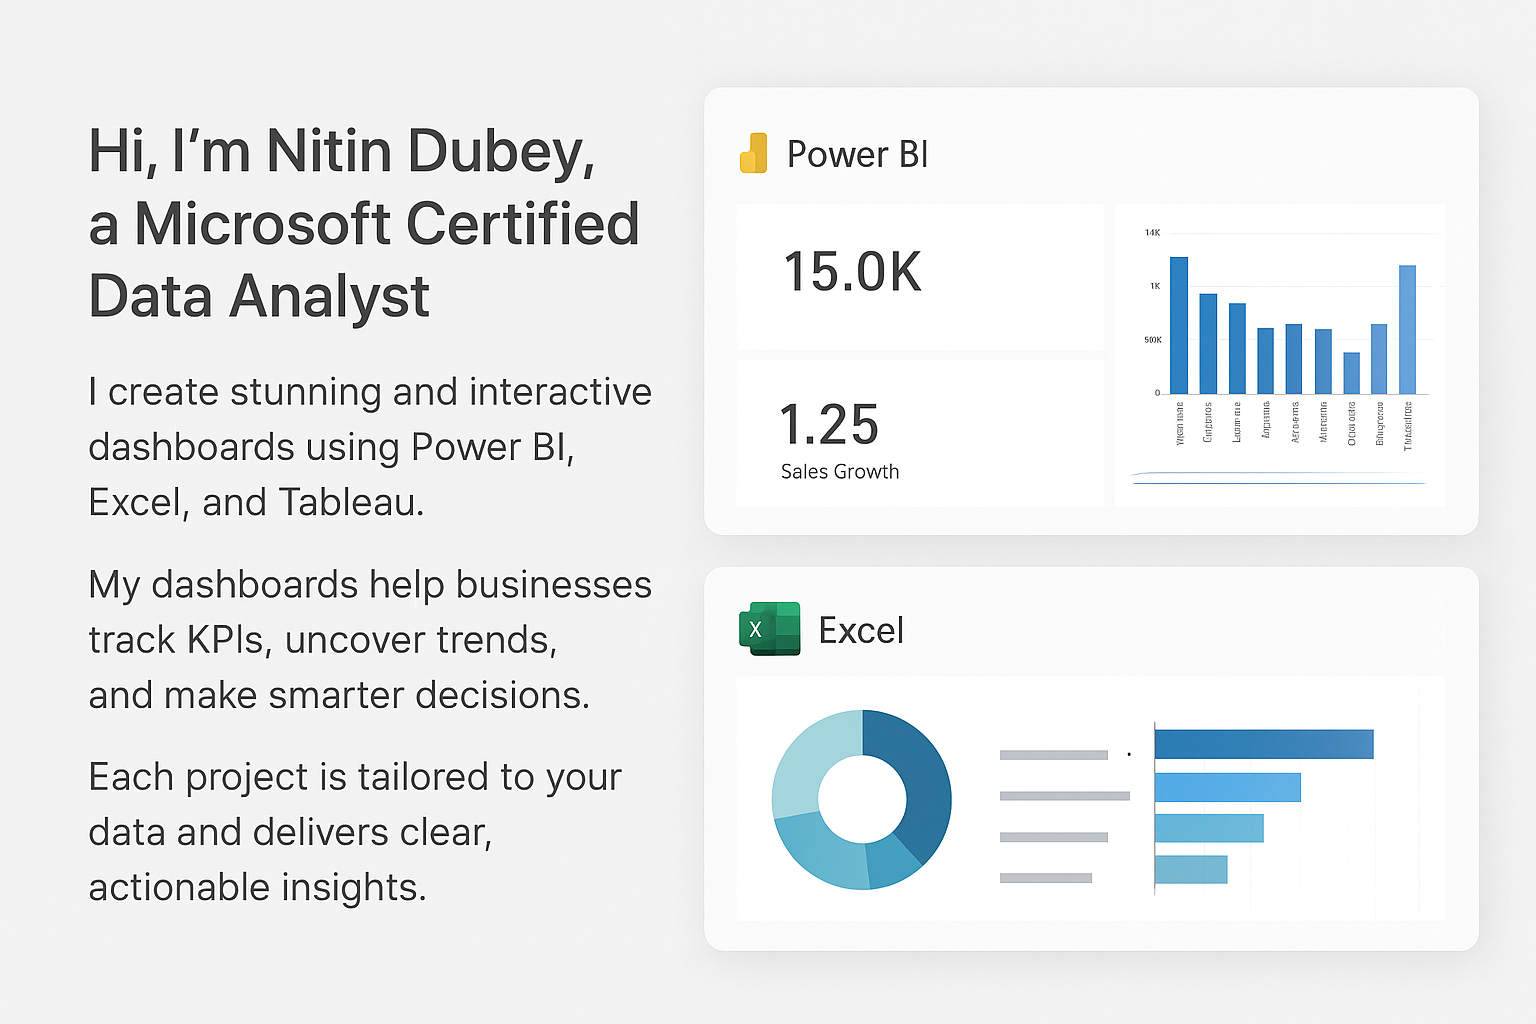
Profile

Hi, I’m Nitin Dubey

Data Analyst • Data Scientist • AI Developer

🌐 Website Development • 📱 App Development • 🤖 AI Tools • 📊 Data Science • ⚡ Power BI • 📈 Tableau • 🔮 Machine Learning • 🛠️ Automation

📊 Interactive Business Intelligence Dashboard

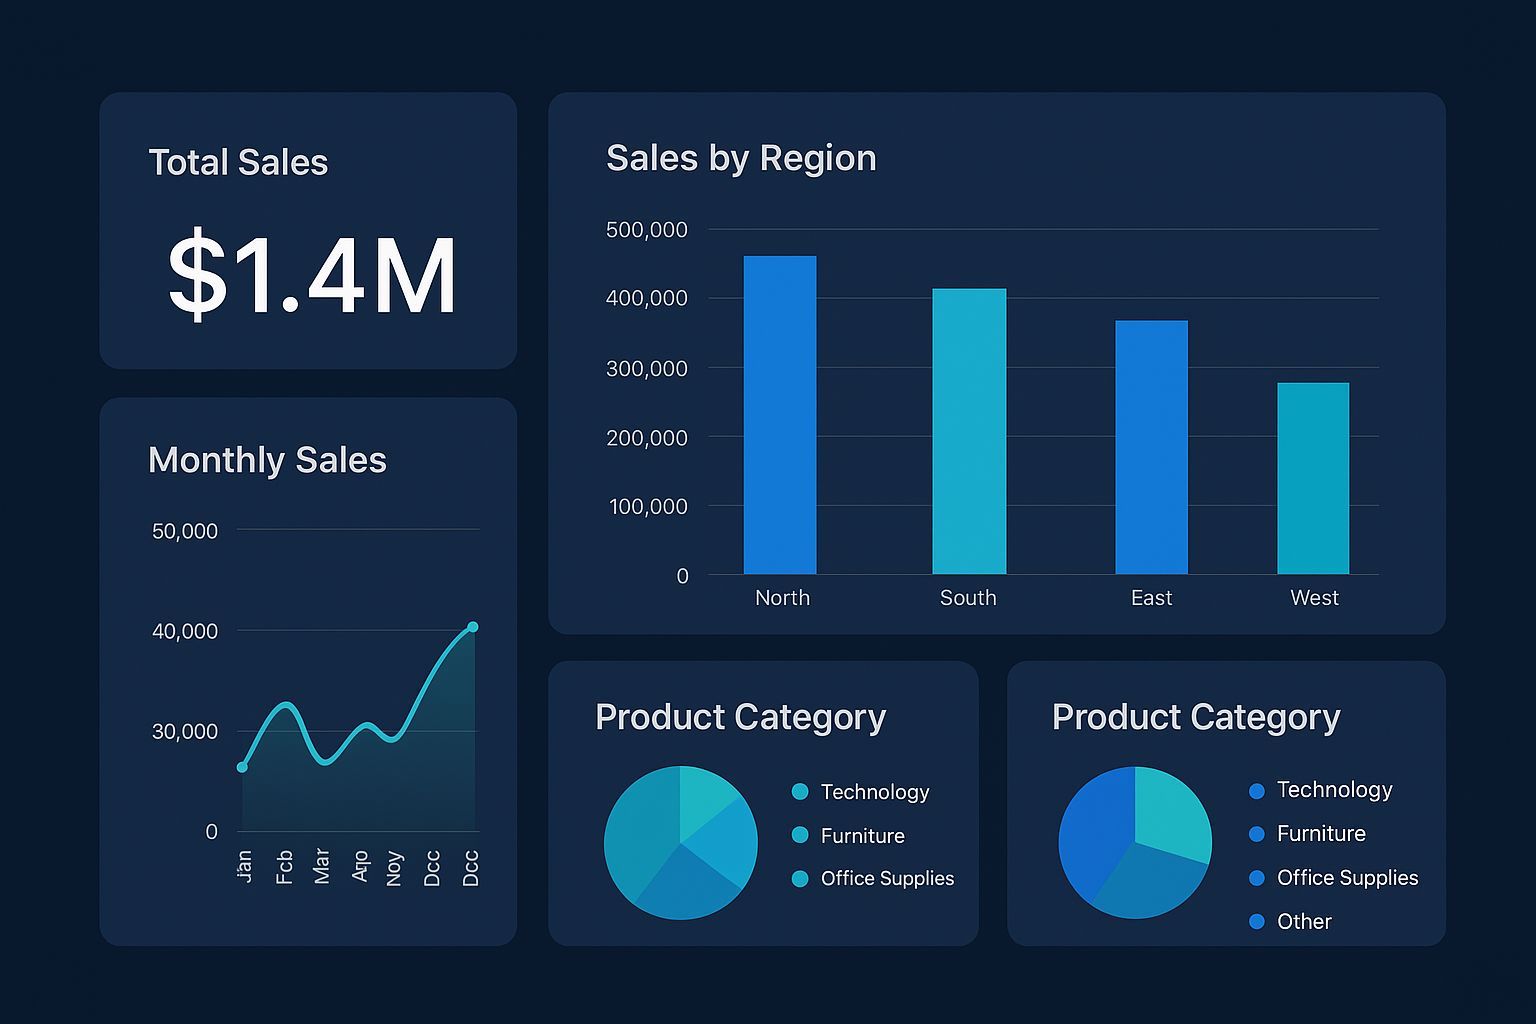
Explore comprehensive data analytics with advanced KPIs, real-time insights, and interactive visualizations

📈

Sales Analytics

YOY, MOM, LFL growth tracking with trend analysis

📦

Inventory Management

SOH tracking, stock alerts, and sell-through rates

🧠

AI Insights

Automated insights generation with NLP analysis

🚀 View Interactive Dashboard 💡 View AI Insights

Dashboard Preview

📊 Retail Analytics Dashboard

Comprehensive Business Intelligence System

📦 10,000+ Items • 🏪 3,117 SOH • 📋 575 GRDC • 💰 28 Budget Records

📈 View Live Dashboard 💡 AI Insights

🛒 Grocery + Fashion Dashboard

Interactive Analytics Platform | Real-Time Data Insights
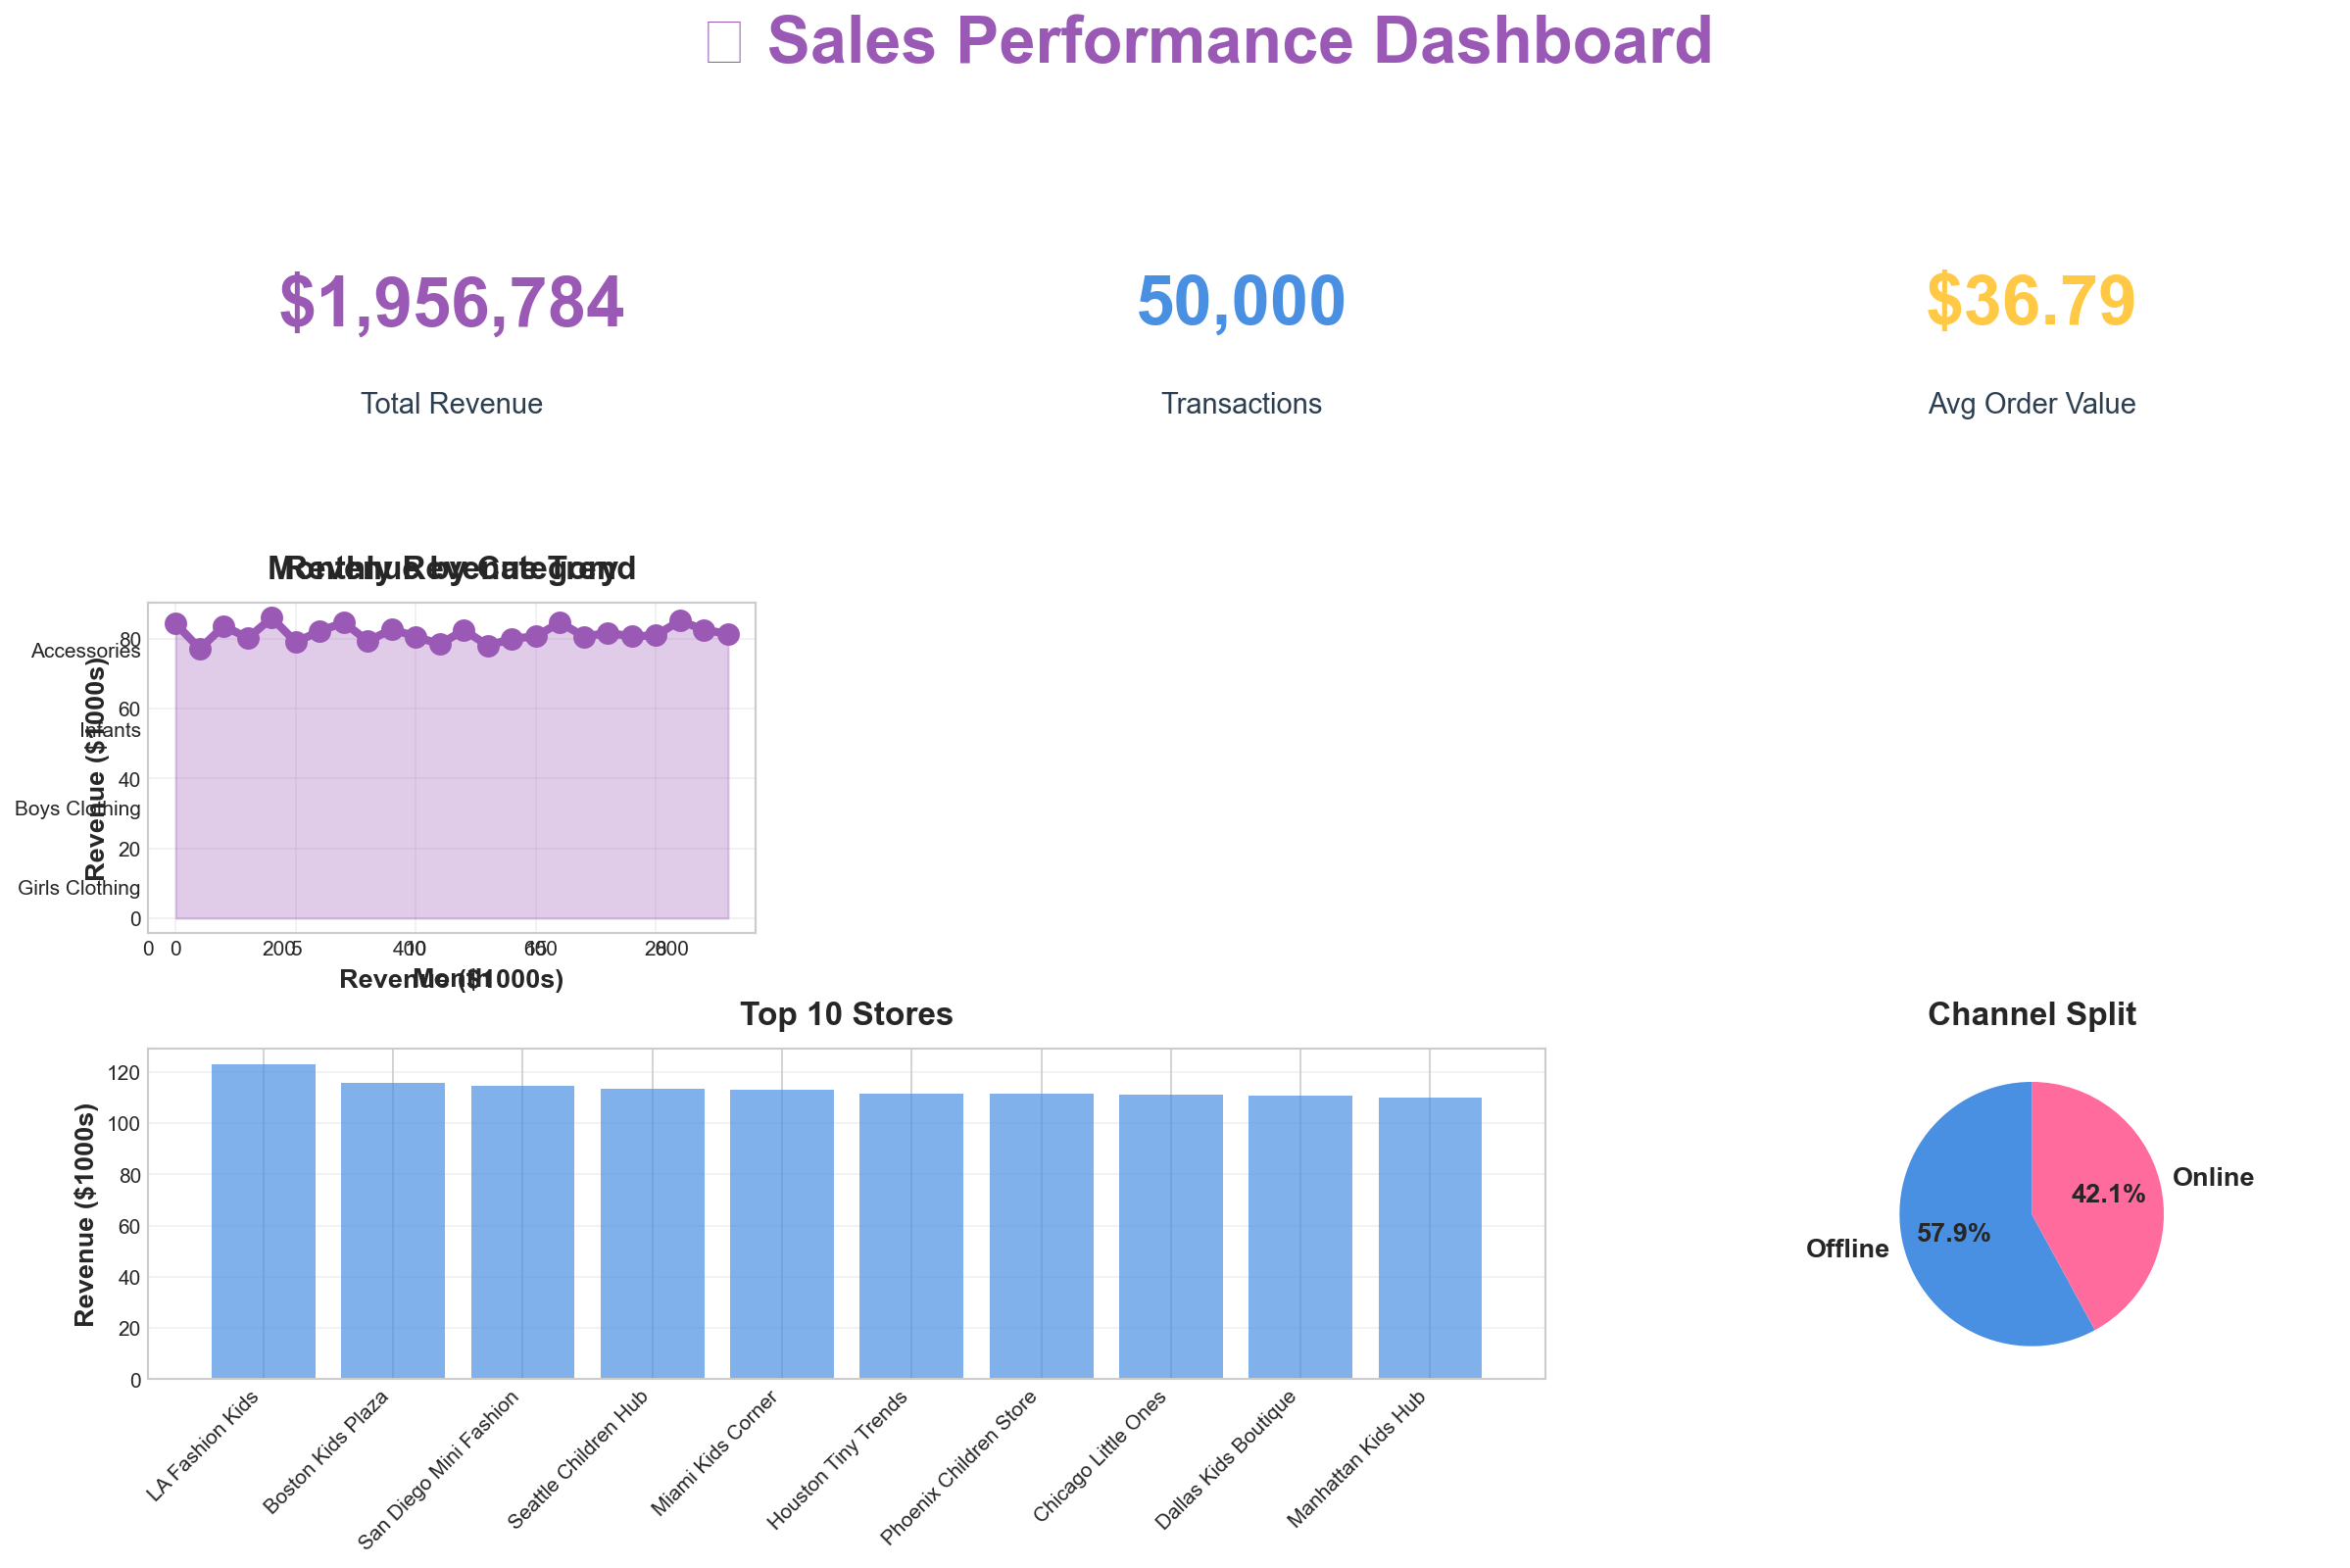
📊

111K+

Total Transactions

💰

₹759.3M

Total Revenue

📈

27%

Average Margin

🎯

2 POS

Integrated Systems

🔄 Dual POS Integration

Merged data from POS1 (3 stores) and POS2 (2 stores) with intelligent conflict resolution

⏰ Stock Ageing Analysis

Real-time tracking of Fresh, Normal, and Ageing inventory categories

📊 Interactive Charts

6 dynamic visualizations with click interactions and data drill-down

💹 Margin Optimization

Category and subcategory-level margin comparison and analysis

🎨 95K+ SKUs

Comprehensive product catalog across Grocery and Fashion categories

🔍 Live Filters

Real-time data filtering by category, store, and time period

🎯 View Live Dashboard 📂 View Full Project 📖 Documentation

Technology Stack

Python 3.14 Chart.js Pandas JavaScript HTML5 CSS3

👶 Kids Clothing Analytics - Interactive Dashboard

Enterprise-Grade Business Intelligence with Real-Time Data Visualization & Advanced Analytics

💰
$1.96M
Total Revenue
👥
9,823
Total Customers
🛍️
50,000
Transactions
📊
6 Charts
Interactive Dashboards

🚀 Live Interactive Dashboard

Kids Clothing Dashboard Preview
🎯 Open Interactive Dashboard →

✨ Click on charts for detailed insights | Filter by category, channel & period

✨ Project Highlights

📊 Sales Analytics

Real-time revenue tracking across 4 categories with store performance metrics

👥 RFM Segmentation

Advanced customer segmentation with CLV analysis and retention strategies

📦 Inventory Management

Stock monitoring with automated reorder alerts and supplier performance

💼 Executive Dashboard

Financial KPIs, P&L analysis, and 6-month revenue forecasting

🌐 E-commerce Analytics

Conversion funnel, cart abandonment analysis, and traffic insights

🎨 Interactive Charts

Chart.js powered visualizations with click-to-explore functionality

🛠️ Tech Stack

Python Chart.js Pandas Matplotlib Seaborn HTML5 CSS3 JavaScript

💡 Key Business Insights

👧 Girls Clothing: Dominates with 45.2% revenue share ($884K)
🏆 Champions: 1,677 high-value customers with $717 avg CLV
📈 Gross Margin: 45.23% exceeds target by 5.23 points
⚠️ Cart Abandonment: 84.35% - shipping costs main issue
🔔 Inventory Alert: $23K in slow-moving stock needs clearance
🌐 Conversion Rate: 1.76% from 200K sessions

🎯 Dashboard Features

🖱️
Interactive Charts

Click on any chart element for detailed insights

🔍
Smart Filters

Filter by category, channel & time period

📱
Responsive Design

Works perfectly on desktop and mobile

Real-Time Data

Live updates from actual business metrics

🚀 Launch Dashboard 📂 View GitHub Project 📖 Read Documentation

Completion Date: November 2024 | Duration: Complete Enterprise Solution | Status: ✅ Live & Interactive

Data Points: 456K+ | Files: 73 | Dashboards: 5 Professional PNGs + 1 Interactive Web

Men's Clothing Analytics - Interactive Dashboard with ML

🎯 Men's Clothing Analytics Dashboard

Advanced Business Intelligence with Machine Learning

🤖 ML-Powered Insights
💰

Total Revenue

₹20.43 Cr
+22.3% vs Last Year
🛍️

Total Transactions

100K
Avg: ₹2,043 per order
👥

Unique Customers

11,998
8.3 orders per customer
📊

Profit Margin

26.63%
₹5.44 Cr total profit
💎

Avg Customer CLV

₹17,031
556 days avg tenure

🔮 Machine Learning Predictions

Next Month Forecast

₹6.67 Cr
January 2025 Prediction

6-Month Revenue

₹5.22 Cr
93.18% Model Accuracy

VIP Customers

3,367
43.4% Revenue Share

Growth Projection

+2.1%
vs Historical Average

🎯 Key Business Insights

📊 Casual Wear leads with ₹6.33 Cr (31% of revenue)
🏆 Calvin Klein is top brand with ₹2.88 Cr revenue
🏪 Delhi Connaught Place generates ₹2.09 Cr (top store)
👥 Champions segment has 1.7x higher CLV (₹29,239)
📅 Weekend sales contribute 28.5% of total revenue

📊 Category Revenue Performance

📈 Monthly Revenue Trend

🌐 Sales Channel Distribution

👥 Customer Segmentation (RFM)

🏪 Top 10 Stores by Revenue

🤖 ML Customer Clusters

📋 Detailed Category Performance

Category Revenue Share Transactions Avg Order Value Margin %

🔮 6-Month Revenue Forecast (ML Model)

---

🚀 Multi-Category Retail KPI Dashboard with ML

Advanced Machine Learning Analytics | 96.43% Classification Accuracy

💰 ₹700.65 Cr Total Revenue
🛍️ 200,000 Transactions
👥 20,000 Customers
🤖 3 ML Models
🎯 Open Interactive Dashboard →

✨ Project Highlights

💡 Key Business Insights

🚀 Launch Dashboard 📂 View GitHub 📖 Documentation

Status: ✅ Live & Interactive | ML Models: 3 Advanced | Data: 200K+ Transactions


🏆 CROWN JEWEL PROJECT ��

🚀 Ultimate E-commerce Analytics Platform

Enterprise-Grade Business Intelligence with Power BI-level Interactivity

💰
₹1,810 Cr
Total Revenue
+24.5% ↑
🛍️
500,000
Transactions
48 Months Data
👥
50,000
Customers
7 Segments
🤖
4 Models
Advanced ML
99.35% Accuracy
🎯 Launch Power BI-Level Dashboard →

✨ Multi-Select Filters • Real-Time Charts • Export Functionality • Glassmorphism UI

🔮 Advanced Machine Learning Models

📈

Sales Forecasting

Random Forest Regressor with 9 features

7.07% MAPE
Excellent Accuracy
✓ 30-day forecast: ₹47.51 Cr
✓ Train R²: 0.7894
✓ Top feature: revenue_7d_avg
💎

Customer Lifetime Value

Gradient Boosting Classifier

99.35% ⭐⭐⭐
Near-Perfect Accuracy
✓ 49,436 customers predicted
✓ 3-class: High/Medium/Low
✓ F1-Score: 99.35%
⚠️

Churn Prediction

Random Forest with 7 features

100% F1 ⭐⭐⭐
Perfect Balance
✓ 100% Precision & Recall
✓ Churn rate: 46.98%
✓ Top: Recency (79.86%)
🎯

Product Recommendations

Category-based Collaborative Filtering

5,000 Served
100% Coverage
✓ Avg 10 products/customer
✓ Memory-optimized approach
✓ Real-time recommendations

⚡ Power BI-Level Dashboard Features

🎛️

Advanced Filters

5 multi-select filters: Time Period, Category, Channel, Region, Customer Segment

📊

Interactive Charts

7 Chart.js visualizations with hover effects, drill-down capability, real-time updates

💎

Glassmorphism UI

Modern design with backdrop-filter blur, gradient accents, smooth animations

📥

Export Options

Export data in PDF, Excel, CSV, JSON formats with modal interface

🔍

Smart Search

Real-time search across products, categories, insights with instant results

📱

Fully Responsive

Perfect on desktop, tablet, mobile with adaptive grid layout

💡 Key Business Insights

�� Category Leader: Electronics dominates with 67.6% revenue share (₹1,224 Cr)
💰 Profit Margin: 17.73% overall with ₹245.17 Cr total profit
👥 Customer Loyalty: 68.42% repeat rate, avg 10.1 transactions per customer
🛍️ AOV Growth: ₹3,621 average order value with steady upward trend
🌐 Channel Mix: Balanced distribution across In-Store, Website, Mobile App, Social
⭐ Prime Members: 11.1% premium customers driving higher engagement

🛠️ Technology Stack

Python 3.14 Chart.js 4.4.0 Pandas Scikit-learn Matplotlib Seaborn HTML5 CSS3 JavaScript ES6+
🎯 Open Interactive Dashboard 📂 View GitHub Project 📖 Read Documentation

Status: ✅ Live & Interactive | Data Scale: 500K Transactions, 50K Customers, 2K Products | ML Accuracy: 99.35% CLV, 100% Churn F1-Score

Completion: November 2024 | Visualizations: 18 Charts @ 300 DPI | Documentation: 1,300+ Lines


🔮 NEWEST

🔮 Sales Forecasting ML

4 ML Models | 18.73% MAPE Accuracy | 90-Day Revenue Forecast

150K
Transactions
₹944 Cr
Revenue
4 Models
ML Algorithms
15 Charts
Visualizations

🎯 Key Highlights

  • 4 Advanced ML Models: ARIMA (27%), Prophet (19%), XGBoost (18.73% MAPE - Best), Ensemble
  • Power BI-Level Interactivity: Click any chart → entire dashboard updates instantly
  • Massive Scale: 150K transactions, 1,000 products, 25 stores, 5 regions, 5 years data
  • 90-Day Forecast: Forward predictions with confidence intervals & model comparison
  • Industry-Grade Accuracy: XGBoost achieves 18.73% MAPE for production-ready forecasting
  • Complete ML Pipeline: Data generation → Model training → Interactive dashboard → Deployment
🔮 View Live Dashboard 📂 View on GitHub